Why BGPT?
logo

Analyze Reported Results With Sources

Work with exact reported values from papers, with provenance for every record.Know what the science actually supports before you trust the answer.

Press Enter ↡ to analyze data


     Long Analysis Plan


    No data was supplied, so I cannot execute the deconvolution itself. To run Weighted Least Squares (WLS) deconvolution, I need your concentration–time (or equivalent response) data, the unit impulse response function, and per-point variance estimates or weighting assumptions. If you upload these, the analysis can proceed.

    What WLS deconvolution does (per the primary methodological source)

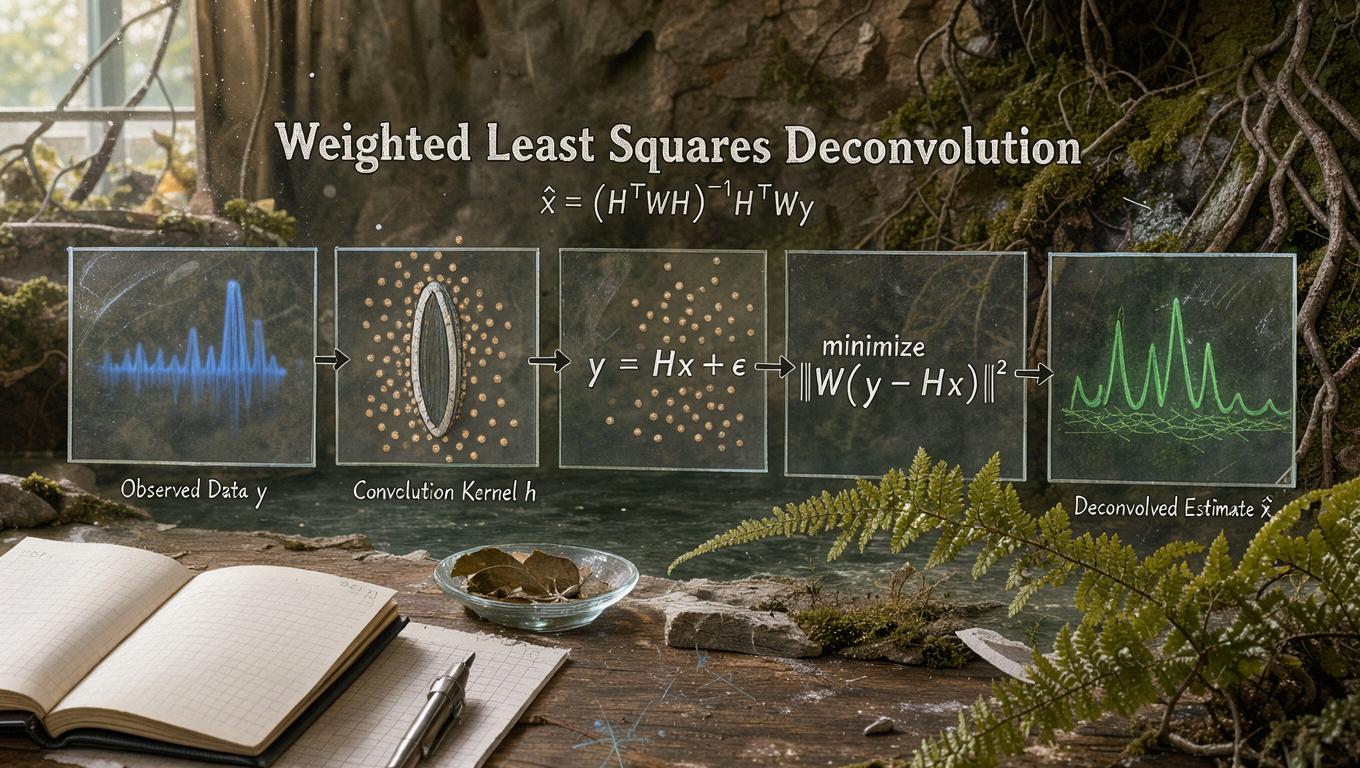
    The canonical method models measured concentrations as the convolution of a drug input function with a unit impulse response (e.g., a two-exponential two-compartment disposition), represents the input as a polynomial, and solves for input coefficients via linear regression with Best Linear Unbiased Estimators. Weights derive from the error structure, and input rate/extent differences between products are tested within-subject via t-tests and F-tests (with discussion of unequal variances). Residual diagnostics include Durbin–Watson and runs tests; sampling should follow a Chebyshev design .

    Reported strengths and limitations

    • Recovering input rate and cumulative input without AUC extrapolation; it can reveal input differences masked by Cmax/tmax/AUC .
    • Validation was simulation-only (three simulated subjects, two-compartment IV bolus plus first-order absorption with lag); real-data validation was not demonstrated in the source.
    • Key assumptions: linear, time-invariant response; noninteracting primary input; correct weighting model; sensitivity to noise, normality, and sample size; the Gauss–Markov framework is only approximate when regressors are stochastic.
    • Results depend on the unit impulse response; parameter non-uniqueness can exist without necessarily biasing the overall input estimate.

    What to upload to run it

    1. Time and concentration columns for each subject/occasion (test and reference products).
    2. Impulse response data or parameters (e.g., IV bolus biexponential coefficients), or the data to fit it.
    3. Variance model for weights (replicates, observed SD, or a variance function).

    Confidence note: the methodological description above rests on a single, simulation-based 1980 source; treat real-data performance as unverified until your data are analyzed.


    Feedback:    

    Updated: October 27, 2026

     Top Data Sources ExportMCP


     Analysis Wizard


    Once your concentration-time and impulse-response data are uploaded, we will be fitting a weighted least-squares deconvolution to recover drug input rate and cumulative input, then testing between-product differences with residual diagnostics.


     Science Art


    Analyze Data: Run Weighted Least Squares Deconvolution on My Data Science Art

     Science Movie


    Make a narrated HD Science movie for this answer ($32 per minute)


     Discussion


    Stay current without chasing every paper.

    Know what changed, what holds up, and what remains uncertain. Every Friday. No ads.


    My BGPT