Plot exact reported values with provenance, so every point traces back to a paper.Know what the science actually supports before you trust the answer.
Press Enter ↵ to create graph
Explore by Goal
"The more we learn about the world, and the deeper our learning, the more conscious, specific, and articulate will be our knowledge of what we do not know, our knowledge of our ignorance."
- Karl Popper
Long Analysis Plan
Copied
Eryptosis in PD Cohorts: Sourced Quantitative Figures
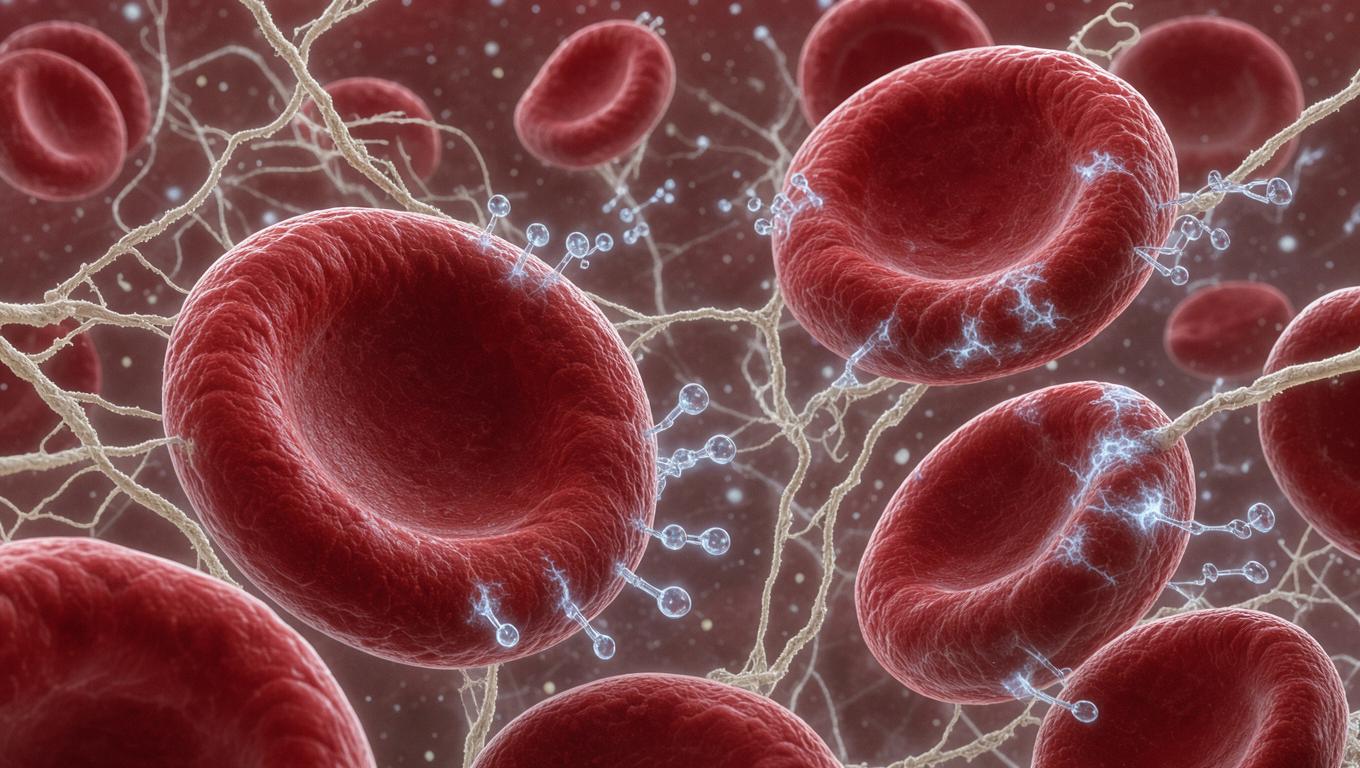
The supplied evidence records contain sufficient quantitative data to graph the peritoneal dialysis (PD) peritonitis eryptosis study directly: PD-peritonitis patients (n=22) showed 7.7% eryptotic RBCs (IQR 4.3–14.2) vs 0.8% (IQR 0.7–1.3) in healthy controls (n=17), p<0.001, measured by Annexin V-FITC flow cytometry . Correlations of eryptosis with peritoneal biomarkers are also reported (pWBC rho=0.77; pNGAL rho=0.64; IL-6 rho=0.61; IL-1β rho=0.64).
A second decisive figure plots the reported Spearman correlations between systemic eryptosis and peritoneal dialysis effluent (PDE) biomarkers, showing local peritoneal inflammation tracks with RBC death .
Analysis plan notes: Graph only values reported above; the record does not provide subject-level data, so box plots represent median + IQR whiskers only (approximation, not full distributions). For a PD cohort graphing pipeline: load the extracted table (pandas), render Annexin V percentages and Spearman ρ with Plotly, annotate p-values, and clearly flag that n=22/17 is small, single-center, and cross-sectional . Related context: the PD stable-cohort review (n=46) reports higher eryptosis in PD vs controls and lower eryptosis with residual diuresis, but only qualitatively — insufficient data to plot without fabricating values.
We'll email you the results when your analysis is finished.
Hypothesis Graveyard
Eryptosis differences between PD and HD are primarily caused by dialysate glucose exposure — the Bissinger et al. RBC-survival results conflict by methodology, so dialysate composition alone cannot explain modality differences.

 Explore by Goal
 Long Analysis Plan
 Top Data Sources
 Ask a Follow-Up
 Key Insight
 Keep Exploring
 Hypothesis Graveyard
 Potential Experiments
 Science Movie
 Discussion
