Check each claim against its experiments, reported results, scope, and stated limitations.Know what the science actually supports before you trust the answer.
Press Enter ↵ to start review
Explore by Goal
"We are just an advanced breed of monkeys on a minor planet of a very average star. But we can understand the Universe. That makes us something very special."
- Stephen Hawking
Quick Explanation
Copied
This is a modest descriptive survey reporting mangrove sediment carbon stocks of 13.87–132.65 Mg C ha⁻¹ across 11 North Minahasa sites (total ~645.19 Mg C ha⁻¹), using loss-on-ignition methods . The findings are locally useful, but the paper suffers from severe unit inconsistencies, internal contradictions, absent statistics, and no replication or error reporting, substantially weakening its scientific reliability.
Long Explanation
Reported Findings
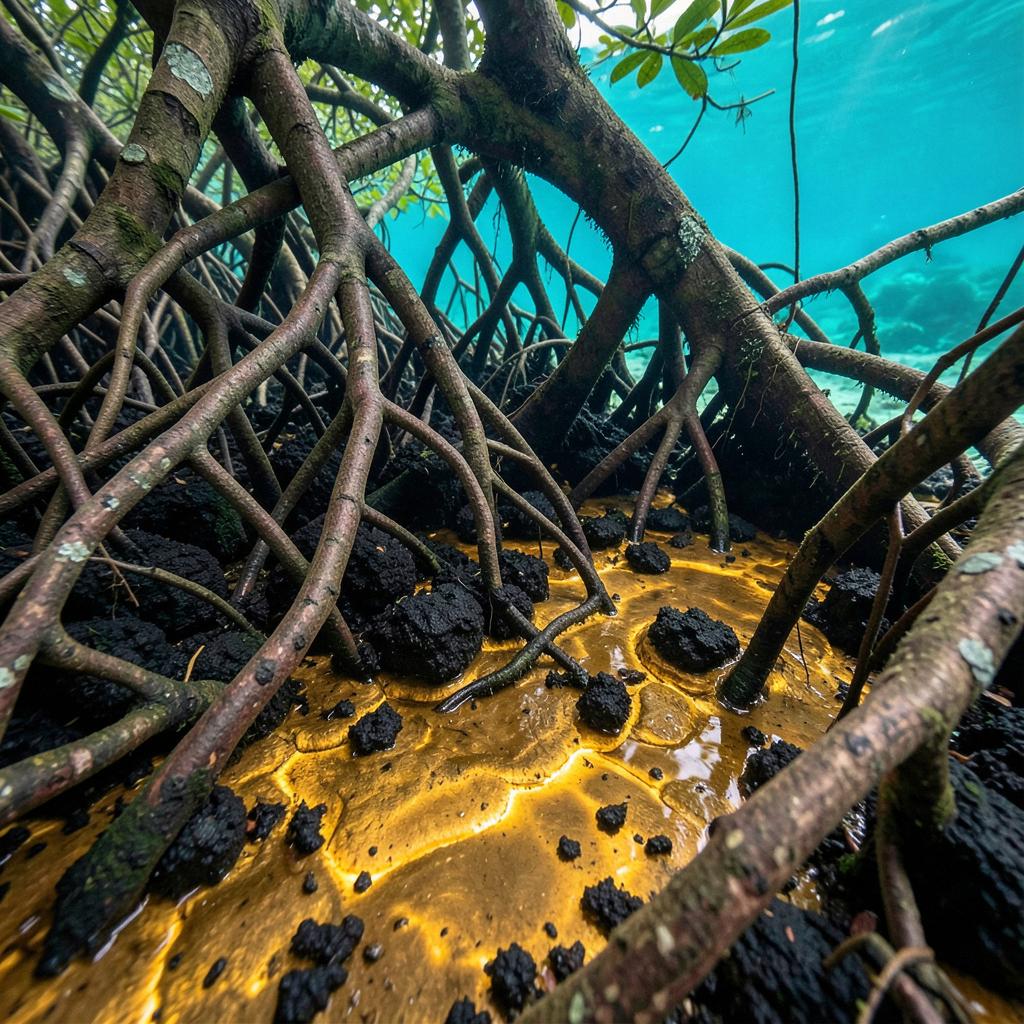
The paper measured sediment organic carbon at 11 coastal and small-island locations in North Minahasa, North Sulawesi, using sediment cores sectioned at 5 cm intervals and loss-on-ignition (LOI) analysis standardized to 1 m depth . Tanah Putih Village had the highest carbon (32.7% C; 132.65 Mg C ha⁻¹) and Paniki Island the lowest (3.45%; 13.87 Mg C ha⁻¹); the authors attribute variation to soil density (0.401–0.414 g/cm³) and depth .
Critical Issues
Unit chaos: Results are reported variously as "mgCh⁻¹", "Mg ha⁻¹", and "Mg C ha⁻¹" without reconciliation; per-location values (13.87–132.65) plus a total of 645.19 Mg C ha⁻¹ cannot be verified from the text. Internal contradiction: the text states the findings are "notably higher than" Ngurah Rai values of 83.046–216.168 Mg ha⁻¹, yet the reported range (13.87–132.65) is mostly lower — this comparison appears reversed. Typographical errors: soil density range "0.414 to 401 g/cm³" is garbled; Talise Island appears twice in an inconsistent carbon list. Missing rigor: no sample sizes per site, no replicate counts, no variance or error estimates, no statistical tests for the claimed density–carbon association (which is correlational only, per the evidence record), and no corroboration from δ¹³C or organic source differentiation despite citing such methods in the introduction. For context, peer-ranked mangrove carbon studies report ecosystem stocks of 398–501 ± 42 Mg C/ha in Hawaiian stands and below-ground stocks of 629–687 ± 29 Mg C ha⁻¹ in Vietnam — both with explicit uncertainty, which this paper lacks. Confidence: the descriptive site-level values are probably directionally sound (LOI is a standard method), but the density–carbon causal claim is unsupported and the 645.19 total cannot be independently verified. What would change this assessment: a published erratum with consistent units, per-interval raw data, and a formal correlation test.
Deepen the Review
Feedback:
Updated: September 22, 2026
BGPT Paper Review
Study Novelty
40%
Site-specific carbon stock data for an under-studied North Sulawesi conservation area fills a local gap, but applies standard LOI methodology to a well-established research question already extensively covered in Indonesian and regional blue carbon literature.
Scientific Quality
30%
Multiple unit inconsistencies (mgC vs Mg C ha-1), an apparently reversed literature comparison (claiming results are 'notably higher' than values clearly exceeding them), a garbled density range (0.414 to 401 g/cm3), duplicated site listings, no statistics, no sample sizes, no error bars, and no formal test of the central density-carbon claim.
Study Generality
40%
Findings apply only to the 11 sampled North Minahasa locations; the density-carbon association is not demonstrated causally and no mechanistic or transferable framework is provided.
Study Usefulness
50%
First baseline carbon data for this specific Marine Conservation Area; locally valuable for blue carbon management and conservation prioritization despite methodological reporting flaws.
Study Reproducibility
40%
LOI protocol is described in reasonable detail (60°C drying, 450°C combustion, 5 cm intervals, Howard et al. 2014 formulas), but coordinates contain apparent errors, replicate numbers are absent, and no raw data are shared.
Explanatory Depth
30%
The paper asserts that soil density and depth 'influence' carbon storage but presents no regression, correlation coefficient, or mechanistic analysis; factors like tidal flushing, sedimentation, and microbial activity are discussed in the introduction but never measured.
We'll email you the results when your analysis is finished.
Hypothesis Graveyard
'Denser mangrove soils cause higher carbon storage' — undermined by the paper's own data pattern (Talise has lowest density 0.401 g/cm³ but third-highest carbon 93.18 Mg C ha⁻¹) and the absence of any reported statistical association; compaction more likely covaries with depth of accumulation, which is circular with the carbon stock calculation itself.

 Explore by Goal
 Quick Explanation
 Long Explanation
 Top Data Sources
 Ask a Follow-Up
 Key Insight
 Keep Exploring
 Hypothesis Graveyard
 Potential Experiments
 Discussion
