Ask questions across claims linked to experiments, exact results, limitations, and sources.Know what the science actually supports before you trust the answer.
Press Enter ↵ to search evidence
Explore by Goal
"Be less curious about people and more curious about ideas."
- Marie Curie
Quick Analysis Plan
Copied
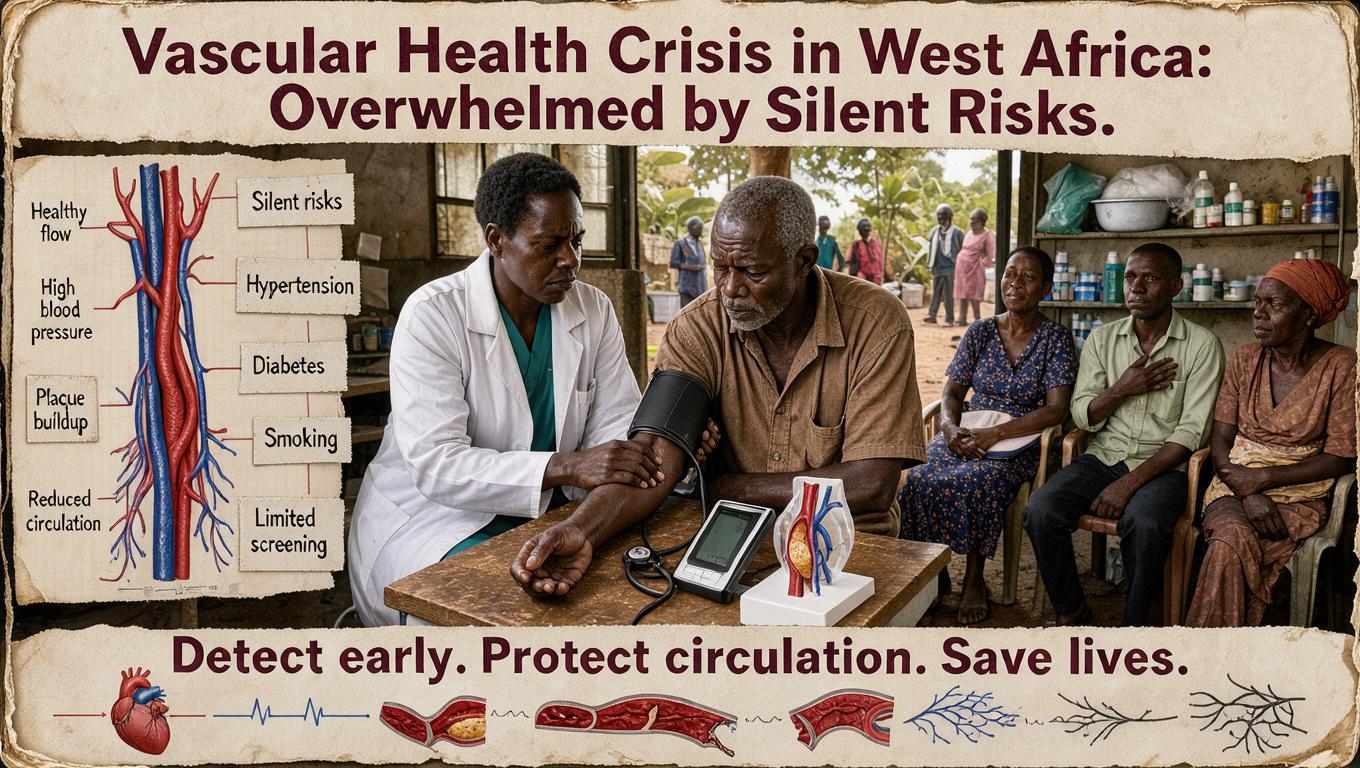
A cross-sectional analysis of the SAGE Ghana database, involving 4305 respondents, highlights that Hypertension is the most significant PVD risk factor at a prevalence of 57.4%, substantially outweighing the risk presented by other tracked conditions .
Long Analysis Plan
The analysis of PVD risk factor distribution in SAGE Ghana relies on data collected from 4305 respondents aged 50 or older, which represents an estimated population of over 2.8 million Ghanaians To visualize this distribution, a comparison of reported risk factor percentages is presented below, juxtaposing the prevalence against the national health burden estimates provided in the study's raw data Data were also disaggregated by age group, revealing the highest representation in the 50-59 demographic (39.8%)
PVD Risk Factor Distribution in Ghana (SAGE Data)
The following visualization uses a bar chart to compare the reported percentage of PVD risk factor prevalence against the corresponding national burden estimate, highlighting the quantitative disparity for each condition.
Bioinformatics Planning and Critical Analysis:
This dataset primarily focuses on epidemiological data from a cross-sectional study rather than biological/genomic sequence analysis. Therefore, the bioinformatics and coding plan shifts to Data Visualization and Statistical Interpretation to accurately present the distribution of health risks
Coding and Analysis Protocol:
1. Data Aggregation and Structuring: The risk factor data (Hypertension, Diabetes, etc.) and their corresponding national estimates are extracted and placed into a Pandas DataFrame structure for easy manipulation using Python. This allows for comparative analysis and standardized visualization. 2. Visualization Strategy: A grouped bar chart (as implemented above) is the optimal choice. This visualization technique allows for the simultaneous comparison of two related quantitative measures—the percentage prevalence of the factor within the study population and the larger national burden estimate—thereby contextualizing the local findings within the broader public health landscape. 3. Statistical Interpretation:Lack of Correlation Analysis: While the data presents correlations between specific risk factors and PVD, the provided snippet does not contain detailed regression or multivariate analysis. Any conclusion regarding the causal link between a single risk factor (e.g., Obesity) and PVD must be treated with caution, as multiple confounding variables (e.g., age, socioeconomic status) are not explicitly controlled for in the provided extracted claims .
4. Potential Enhancements: A sophisticated Network Analysis could be planned to identify clusters of interrelated risk factors (e.g., Obesity, Hypertension, and Cardiovascular disease) using tools like NetworkX, provided more detailed patient profiles and co-morbidity data were available. Since only aggregated percentages are present, this advanced analysis is currently not possible.
Evidence Strength and Critical Viewpoint: The evidence presented regarding the high prevalence of Hypertension (57.4%) is supported by a publicly available study using large, aggregated database samples (SAGE/IHME GBD) . However, the reliance on large, aggregated database studies carries the risk of over-generalization, as it may not fully capture the heterogeneity of the population or specific localized risk profiles. The primary blind spot is the lack of detail on socio-economic confounding factors, which could significantly influence both lifestyle risk factors and access to care.
Hypothetical Future Research Direction: To strengthen these findings, a longitudinal cohort study of high-risk Ghanaian adults, integrating genomic markers for genetic predisposition to hypertension and local environmental exposures, would be required to establish causality beyond mere correlation.
We'll email you the results when your analysis is finished.
Hypothesis Graveyard
The initial assumption that PVD cases are primarily driven by poor personal lifestyle choices is insufficient, as the structural failure of the healthcare system (diagnostics and surgical care gaps) fundamentally dictates the actual risk and progression of the disease in this population .

 Explore by Goal
 Quick Analysis Plan
 Long Analysis Plan
 Top Data Sources
 Ask a Follow-Up
 Key Insight
 Keep Exploring
 Hypothesis Graveyard
 Potential Experiments
 Discussion
