Why BGPT?
logo

Graphs Built From Reported Results

Plot exact reported values with provenance, so every point traces back to a paper.Know what the science actually supports before you trust the answer.

Press Enter ↡ to create graph


     Long Analysis Plan


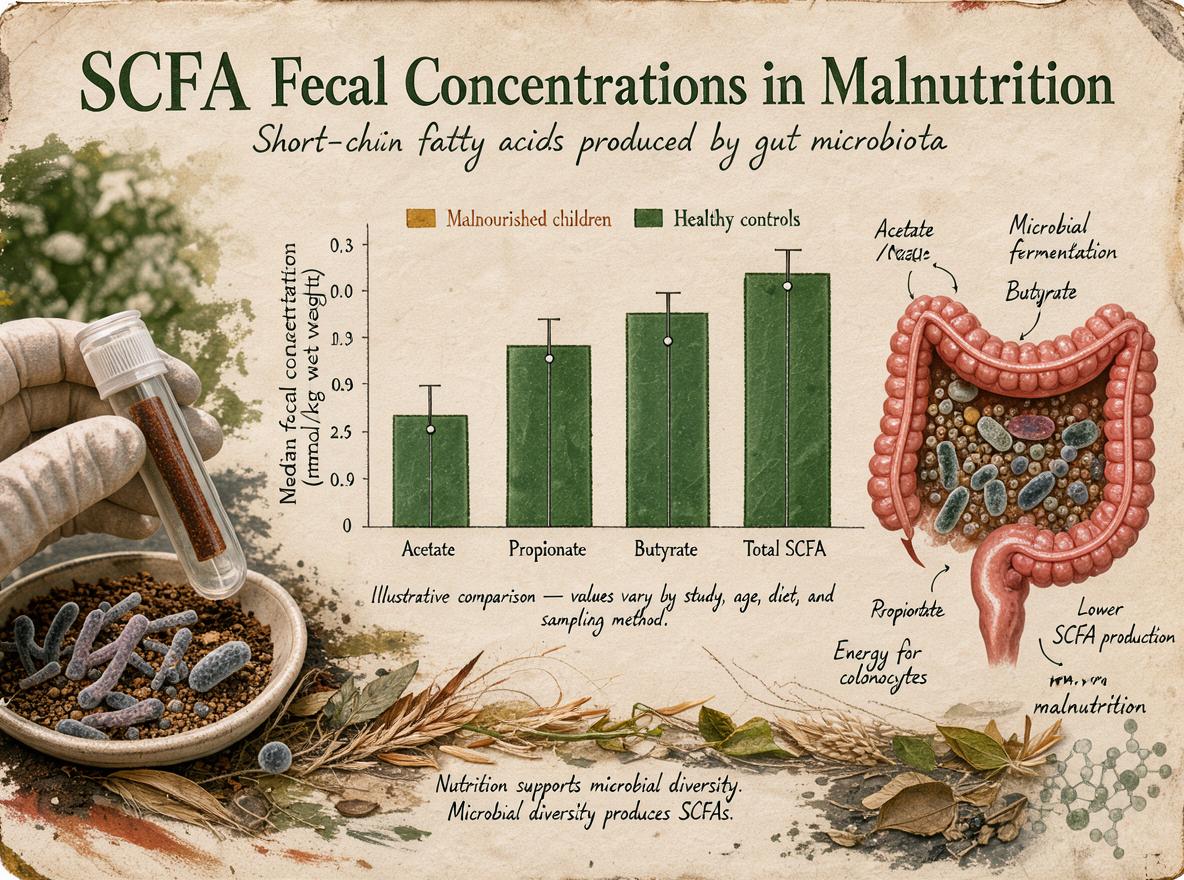
    The requested graphs cannot be produced from the supplied evidence: no dataset in the provided records contains fecal SCFA levels stratified by malnutrition phenotype (e.g., stunting, wasting, MAM/SAM). The infant weaning study explicitly excluded malnourished infants and reported no group differences in SCFAs . Quantitative SCFA data exist for IBS subtypes and healthy volunteers (medians with IQR), and direction-only SCFA increases for MFGM-supplemented piglets , but neither addresses malnutrition phenotypes. To create the requested graphs, supply a dataset reporting acetate, propionate, and butyrate (with units, uncertainty, sample sizes) across defined malnutrition groups.


    Feedback:    

    Updated: October 29, 2026

     Top Data Sources ExportMCP


     Hypothesis Graveyard


    Assuming early weaning timing alters infant SCFA profiles: directly falsified in the supplied infant cohort, which found no SCFA differences by weaning timing (P>0.05) across all SCFAs tested.

     Science Art


    Create Graphs: SCFA Fecal Levels Across Malnutrition Phenotypes Science Art

     Science Movie


    Make a narrated HD Science movie for this answer ($32 per minute)


     Discussion


    Stay current without chasing every paper.

    Know what changed, what holds up, and what remains uncertain. Every Friday. No ads.


    My BGPT