Plot exact reported values with provenance, so every point traces back to a paper.Know what the science actually supports before you trust the answer.
Press Enter ↵ to create graph
Explore by Goal
"One never notices what has been done; one can only see what remains to be done."
- Marie Curie
Quick Analysis Plan
Copied
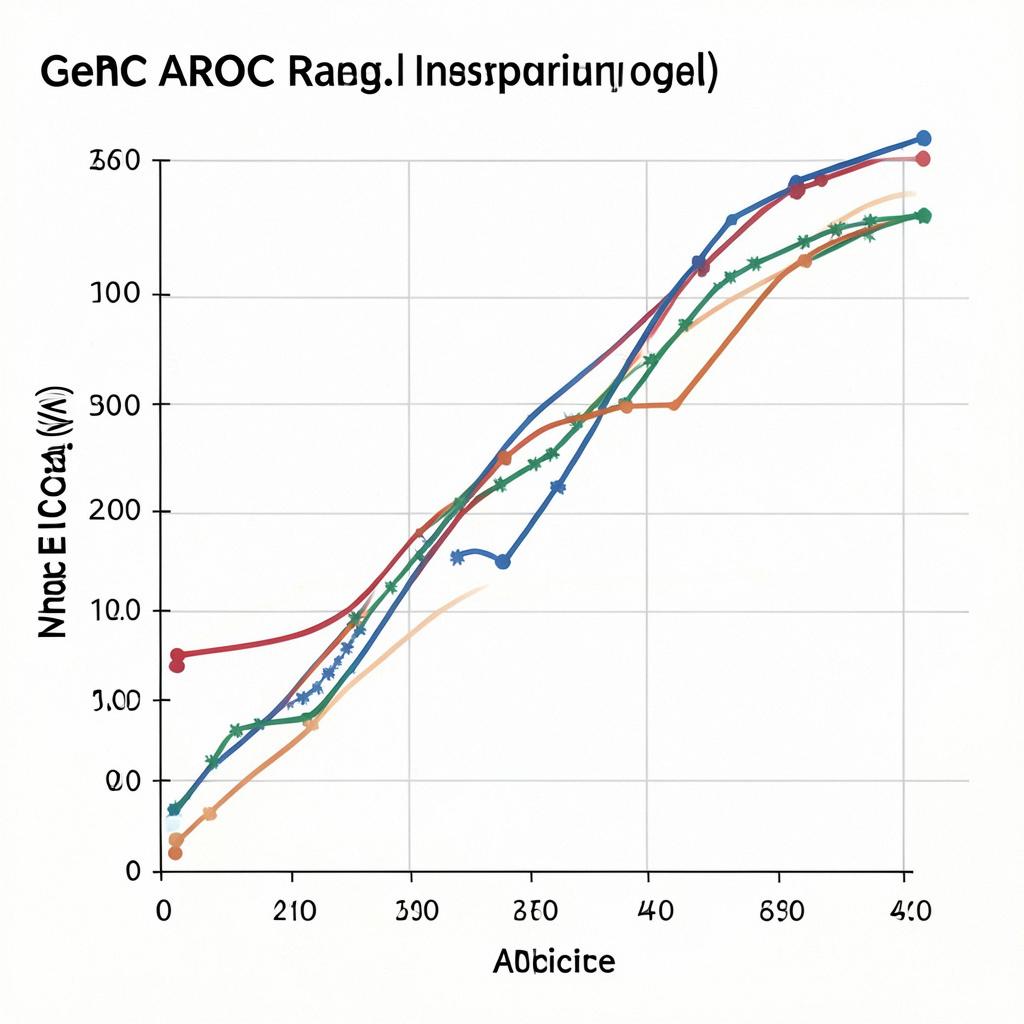
No per-gene AUC values exist in the supplied evidence, so per-gene ROC curves cannot be plotted yet; however, the records do contain reported nomogram AUCs — GDM nomogram 0.76 training / 0.72 validation and metastatic gastric signet ring carcinoma nomogram AUCs 0.845/0.793/0.751 (3/6/12-month, training) vs 0.800/0.735/0.693 (validation) , which are graphed below alongside a complete Python workflow to generate full ROC curves from your raw per-gene and nomogram score data.
Long Analysis Plan
What the evidence supports plotting now vs what is missing
The supplied records contain no per-gene AUC values (no gene-level ROC statistics for LDOC1, FUT8, EGFR, or any other gene), so per-gene ROC curves cannot be rendered from these records alone. What IS reported: (1) the NHR nomogram AUCs with confidence intervals, and (2) the GSRC survival nomogram AUCs at 3/6/12 months, both from cohort splits (994/427 training-validation and 703/300 respectively) . These are graphed below (reported values only, not simulated ROC curves).
Note: blue = training cohort, light blue = validation. Error bars (CI 0.72–0.80 and 0.66–0.78) exist only for the GDM model; GSRC AUCs were reported without CIs, an asymmetry reflecting differences in reporting completeness.
Analysis plan: generate full ROC curves + per-gene AUCs from raw data
Once you supply the raw per-gene expression/score data and nomogram risk scores with outcome labels, run this workflow:
Python workflow (sklearn): 1) Load a tidy table: rows = samples, columns = per-gene values (e.g., LDOC1, FUT8, EGFR IHC/expression), nomogram total point score, and binary outcome (GDM yes/no, survival at horizon, or gefitinib response). 2) For each predictor, call sklearn.metrics.roc_curve(y, predictor) and roc_auc_score; bootstrap 1000 resamples for 95% CIs. 3) Overlay the nomogram ROC on the same axes as the best single gene to test added discriminative value (DeLong test via roc_auc comparisons or statsmodels). 4) Plot in Plotly with diagonal reference line (AUC 0.5), per-gene curves in muted colors, nomogram curve emphasized in the accent color. Validation-set curves should be a separate panel to avoid optimistic bias, since single-center, internally validated nomograms can overestimate performance .
Blind spots to check: the GSRC nomogram AUCs decline monotonically with prediction horizon (0.845 → 0.693), typical for survival models — compare AUCs only at matched horizons. Neither nomogram record reports per-gene contributions, and the EGFR SISH data (10 mutation-positive patients listed) are far too small (n=96 cohort, 31 mutations) to support a stable ROC curve for EGFR copy number as a screening test .
What would change this conclusion
If you upload per-gene expression matrices with outcomes (e.g., the LDOC1 cohort of 200 NSCLC patients or the GDM lab panels), per-gene AUCs become directly computable and the plot above would be replaced by true ROC curves. Falsifying the nomogram utility shown here would require external-cohort validation showing AUC degradation below ~0.65.
Building per-gene and nomogram ROC curves with bootstrap 95% CIs and DeLong comparison from uploaded predictor-outcome tables, visualized as publication-quality overlaid curves.
Get emailed when your analysis is done!
We'll email you the results when your analysis is finished.
Hypothesis Graveyard
'EGFR copy number can substitute for mutation testing in NSCLC screening' — falsified by low sensitivity/PPV of SISH in a 96-patient cohort.
'A single nomogram AUC generalizes across prediction horizons' — contradicted by the 0.845 vs 0.693 spread at 3 vs 12 months.

 Explore by Goal
 Quick Analysis Plan
 Long Analysis Plan
 Top Data Sources
 Ask a Follow-Up
 Key Insight
 Keep Exploring
 Analysis
 Hypothesis Graveyard
 Potential Experiments
 Discussion
